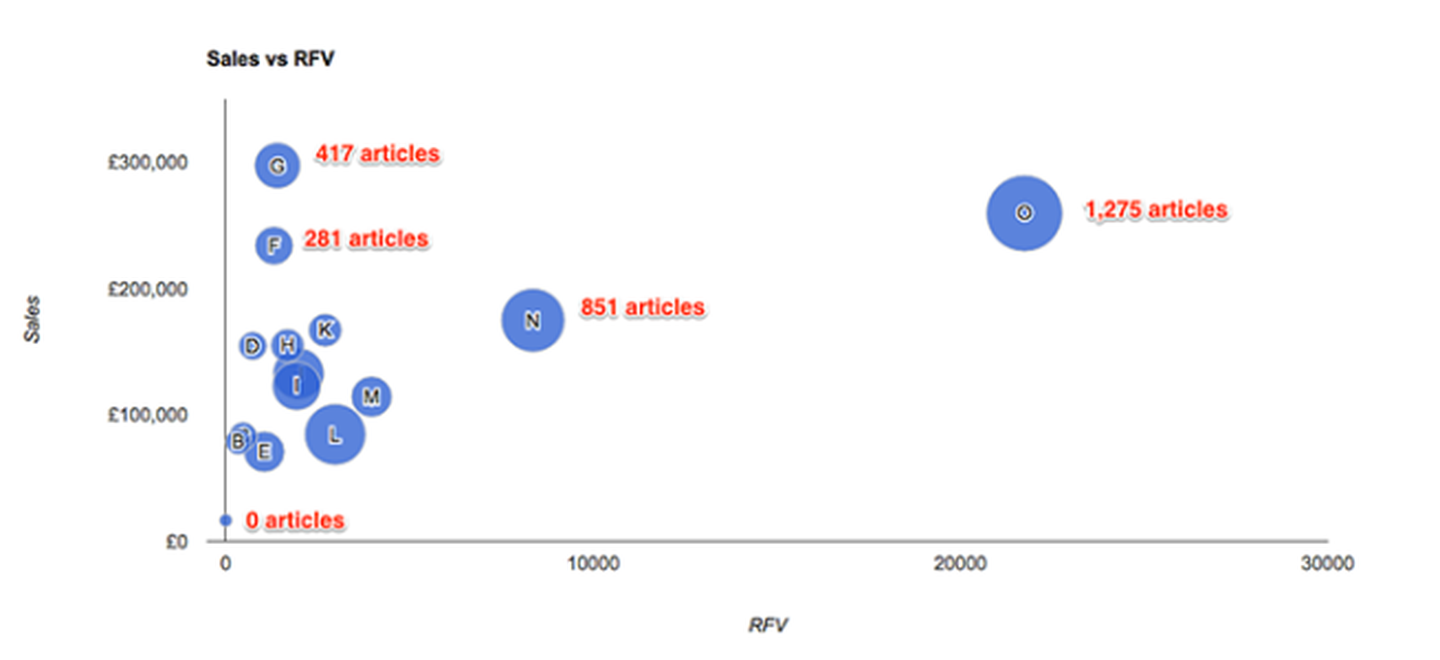
This graph shows the actual sales performance for a 15 person sales team and how much each person has read the FT digitally.
- On the vertical axis is the amount of sales per person
- On the horizontal axis is a score for how well read that person is. The score measures the Recency, Frequency and Volume of reading the FT digitally (RFV)
- The size of the bubble indicates how many FT articles this person has read in the last 5 months
For example, Sales Person N has a reading score of 8,000ish, has sold £175k and read 851 articles.
There is a correlation of 0.47 between individual sales performance and reading scores. This means that these two variables change with some “moderate” consistency. A score of 1 would mean the two variables have a strong tendency to change together, while a score of 0 would mean there is no link between them.
You can see something of a pattern. The person who sold least, read nothing, while the person who read most has one of the highest sales.
There is a correlation – that does not necessarily mean that reading the FT helps you sell more, but could be a contributing factor. It may be that selling well means you have more time to read the FT! Or that there is a third factor that influences both sales and reading, e.g. doing lots of research in preparation for a sale. Also, reading the newspaper isn’t captured in this analysis.
This is the type of analysis that we are doing, at no charge, for clients who spend over £100k and who want to assess their commerciality. We are also working with clients to keep their market facing teams alert to information on prospects, then exploring whether there is a higher correlation with sales outcomes.
Please get in touch if you would like to find out more or take part in the study.
